
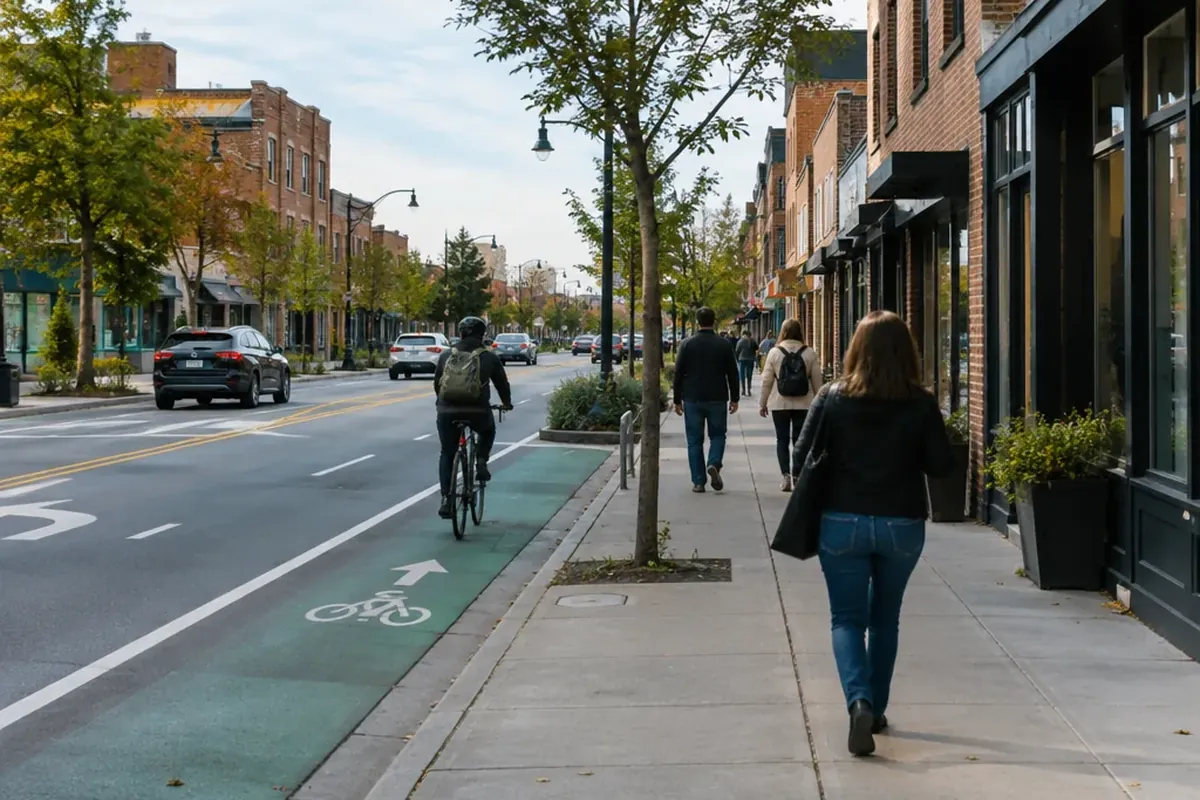
A road diet is a roadway reconfiguration that removes travel lanes and gives the space to other uses, such as a center turn lane, bike lanes, pedestrian refuge islands, transit stops or parking. The classic version turns a four-lane undivided street into three lanes: one through lane in each direction plus a two-way left-turn lane in the middle. The Federal Highway Administration (FHWA) classifies road diets as a proven safety countermeasure. Studies of converted four-lane roads report 19 to 47 percent fewer crashes, and many of these corridors carry about as many cars as they did before.
What Is a Road Diet? The Basic Reconfiguration and Its Variations
The term “road diet” has been in use for more than three decades. One of the first installations in the U.S. dates to 1979 in Billings, Montana. The idea behind it is that a four-lane undivided road has no space set aside for turning traffic, so a driver waiting to make a left turn stops in an active travel lane and the cars behind have to brake or change lanes around them. A center two-way left-turn lane (TWLTL) moves those turning vehicles out of the through lanes.
The four-to-three conversion is the most common type, but FHWA documents several variations:
| Before | After | What changes |
|---|---|---|
| 4 lanes, undivided | 3 lanes | One through lane in each direction plus a center TWLTL; leftover width often becomes bike lanes |
| 4 lanes | 5 lanes | Two lanes in each direction are kept and a TWLTL is added |
| 2 lanes | 3 lanes | A center turn lane is added |
| 3 lanes | 3 lanes | Lanes are narrowed to make room for other uses |
| 5 lanes | 3 lanes | Freed space goes to features such as diagonal parking and protected bike lanes |
FHWA ties road diets to Complete Streets, meaning streets designed for every road user, not only drivers. Its Traffic Calming ePrimer also lists road diets as a traffic calming measure in their own right (Module 3.20). On 300 West Street in Salt Lake City, a Complete Streets project used a road diet to lower vehicle speeds and shorten crossing distances for pedestrians and bicyclists.
How a Road Diet Improves Safety for Drivers, Pedestrians and Cyclists
Drivers: fewer conflicts and more even speeds
On a four-lane road, fast drivers can pass slower ones, so speeds vary a lot from car to car. On a three-lane road with a TWLTL, the lead vehicle in each through lane sets the pace, and left-turning vehicles wait in their own lane. After conversions in Minnesota, median mean speeds and median 85th percentile speeds each dropped by 2 mph. On Charlotte’s East Boulevard, where the posted limit is 35 mph, the 85th percentile speed fell from 43 to 40 mph. On Seattle’s Stone Way, the number of drivers going more than 10 mph over the limit dropped by more than 80 percent.
Pedestrians: shorter crossings, slower cars
Pedestrians have one fewer travel lane to cross, so they spend less time exposed to moving traffic. Space freed by the road diet can hold pedestrian refuge islands, which can reduce pedestrian-related crashes by up to 46 percent. Location matters too: more than 70 percent of pedestrian fatalities happen at midblock crossings, and refuge islands are built for exactly those spots. Speed matters even more. A pedestrian hit at 20 mph has about a 5 percent chance of dying; at 40 mph the chance is 85 percent. On Stone Way, pedestrian collisions dropped by 80 percent after the conversion.
Cyclists: room for a bike lane
The width saved by removing a lane is often used for a bicycle lane. With flexible delineators, that lane can be buffered or protected. Even without a bike lane, a three-lane road is easier to share. A driver approaching a bicyclist can move toward the center turn lane, while on a four-lane undivided road the left lane is carrying moving traffic. On Stone Way, bicycle volumes rose 35 percent, and bikes made up nearly 15 percent of peak-hour traffic.
Do Road Diets Work? What the Crash Data Shows
Most studies find large safety benefits, though how large depends on the setting:
| Study / location | Sites and traffic | Result |
|---|---|---|
| Combined analysis: California, Iowa, Washington | 45 sites | 29% fewer total crashes |
| Iowa small towns (same analysis) | AADT 3,718–13,908 | 47% fewer crashes |
| California/Washington suburbs (same analysis) | AADT 6,194–26,376 | 19% fewer crashes |
| Noyce et al. (2006), Minnesota | 7 sites, ADT 8,900–17,400 | 44% fewer total crashes |
| Pawlovich et al. (2006), Iowa | 15 sites, ADT 4,766–13,695 | 25.2% fewer crashes per mile |
| Rhode Island (CMF Clearinghouse) | — | 29% fewer total crashes; 37% fewer fatal/injury crashes |
| Huang et al. (2003), FHWA | — | 6% fewer than control sites; no significant change in crash rates or severity |
The earliest FHWA study is the outlier: it found only a modest 6 percent effect. Later work using the empirical Bayes method, which corrects for the statistical distortions in simple before-and-after comparisons, consistently found larger drops. The pattern also shows a gap between settings. Low-volume small-town roads in Iowa improved more than busier suburban corridors on the West Coast. Agencies can plug the crash modification factors from FHWA’s CMF Clearinghouse into a benefit-cost analysis. Rhode Island’s values, for example, are 0.71 for total crashes and 0.63 for fatal/injury crashes.
How a Road Diet Affects Traffic Flow, Congestion and Emergency Response
Capacity: why two lanes can carry the same traffic as four
The most common objection is that going from four lanes to two through lanes cuts capacity in half. In practice, four-lane undivided roads often work below their theoretical capacity, because the inside lane doubles as a left-turn lane and drivers keep weaving around stopped cars. Agencies often find that travel times stay the same or even improve after a road diet. On Stone Way, the corridor carried the same number of vehicles at peak hour after the conversion as before. Daily traffic on parallel streets actually fell by 12 to 34 percent, so drivers did not divert to neighborhood streets.
Results vary, though. After San Jose’s Lincoln Avenue pilot, total traffic in the Willow Glen area dropped 2 percent, but some individual neighborhood streets saw noticeable increases. That is why monitoring diversion is part of any responsible plan. In Pasadena, a road diet made crossing so much easier that the city no longer needed a planned pedestrian signal, which saved money and avoided signal delays for drivers.
Emergency vehicles
FHWA reports that road diets do not slow emergency response, and the center turn lane can give emergency vehicles a clear path. In Cedar Rapids, Iowa, an analysis of EMS response data found no meaningful change after four-to-three conversions; three-quarters of road segments showed minimal change. In a survey of EMS drivers, 34 percent preferred the converted streets, 50 percent were neutral and 14 percent avoided them. Most complaints were about other drivers not knowing how to yield, which public education can fix. A San Francisco study added a caveat: on highly congested corridors, lane reductions were associated with slower emergency vehicle speeds. Even so, it rejected the idea that streetscape changes in general hurt emergency operations.
Transit
Effects on buses depend on the design. Des Moines added bus turn-outs, while in some less urban areas, traffic backed up behind stopped buses. On Grand Rapids’ Burton Street, the bike lane also serves as a pull-off space so buses can stop without blocking the through lane. On Seattle’s Dexter Avenue, transit travel times held steady and bus ridership rose 30 percent between 2010 and 2013.
Which Roadways Are Good Candidates for a Road Diet
Traffic volume is the first filter. FHWA says roads carrying 20,000 vehicles per day or fewer may be good candidates, and its Myth Buster sheet breaks that down further:
| Average daily traffic (ADT) | FHWA rating |
|---|---|
| Under 10,000 | Great candidate |
| 10,000–15,000 | Good candidate in many instances |
| 15,000–20,000 | Good candidate in some instances |
Peak-hour volume matters too. A road diet is probably feasible at or below 750 vehicles per hour per direction, should be considered cautiously between 750 and 875, and is less likely to work above 875. Some guidance is more conservative: the Iowa DOT Design Manual sets 15,000 to 17,500 vehicles per day as the maximum for a three-lane road with a TWLTL. Other evidence points the other way. A 2011 Kentucky study found road diets could work up to 23,000 vehicles per day, and urban projects have succeeded at ADTs as high as 26,000. A 2024 study of five Los Angeles corridors carrying 23,000 to 28,000 vehicles a day found 31.2 to 100 percent fewer collisions than on untreated corridors, with average speeds 6.7 percent lower at peak and 7.9 percent lower off-peak. The authors argue the 20,000 threshold deserves a closer look.
Road Diet Examples from U.S. Cities
| City / corridor | Project | Documented outcome |
|---|---|---|
| Seattle, Stone Way (2007) | 4 to 3 lanes plus bike lanes | 14% fewer crashes, 80% fewer pedestrian collisions, 35% more bicyclists |
| Seattle, Dexter Avenue | Two stages: 4 to 3 to 2 lanes | 300 southbound cyclists per hour at AM peak; bus ridership up 30% |
| Charlotte, NC, East Boulevard (2006–2011) | Three phases over 1.5 miles | 85th percentile speed 43 to 40 mph; fewer crashes; $43 million rise in non-residential tax value |
| Manhattan, 9th Avenue (2007) | 4-lane one-way to 3 lanes with separated bike path and pedestrian islands | 58% fewer injuries to all street users; ITE Transportation Planning Council Best Program Award |
| Indianapolis Cultural Trail (2008) | Road diets used to complete an 8-mile trail | $300+ million in new development along the route, 2008–2012 |
| Los Angeles, Silver Lake Boulevard | Road diet with ADT peaking near 28,000 | 35.7% fewer collisions than untreated comparison corridors |
| Genesee County, Michigan | Since 2009, every 4-lane road is rated 1–4 stars for road diet potential | Residents now favor the 3-lane cross-section |
Building a Road Diet Plan: Costs, Timing and Funding
A road diet plan comes down to choosing the right corridor, the right design and the right time to build. Timing affects cost the most:
- Screen corridors. Start with four-lane undivided roads, compare their ADT and peak-hour volumes against the thresholds above, and review their crash history. Genesee County’s star rating system turns this step into routine practice.
- Choose the design. Basic restriping costs an estimated $25,000 to $40,000 per mile. Adding curb extensions, raised medians or refuge islands can push costs to $100,000 or more per mile.
- Pair it with resurfacing. Combining a road diet with scheduled resurfacing can cut costs by more than 50 percent. One 5,000-foot conversion dropped from about $100,000 to about $46,000. If it is planned together with reconstruction or an overlay project, the reconfiguration can cost nothing beyond the base project.
- Budget for standalone scope. A standalone project on US Route 1 in Fairfield, Connecticut, covering 1.5 miles with mill and overlay, sidewalk ramps and signal work, is estimated at $2.15 million.
- Line up funding. Eligible sources include the Surface Transportation Program, the Highway Safety Improvement Program, Safe Routes to School and other Federal-aid funds.
How to Measure a Road Diet’s Success
FHWA recommends at least three years of police-reported crash data from before and after the project. A sound evaluation tracks:
- Safety: annual crash frequency, crashes per million vehicle miles traveled, crash severity, and specific crash types (sideswipe, left-turn, right-angle, pedestrian and bicycle), including peak-hour crashes.
- Operations: mean and 85th percentile speeds, arterial level of service, delay, queuing, intersection volume-to-capacity ratios and turn delays, and traffic volumes, including diversion to parallel routes.
- Livability and economics: pedestrian and bicycle safety, transit operations, property values and business sales.
Method matters. Corridors are often chosen because they have unusually many crashes, and crash counts at such sites tend to drift back toward normal even without changes. This effect is called regression to the mean. Empirical Bayes methods correct for it, so a simple before-and-after comparison doesn’t overstate the benefit.
Common Myths About Road Diets
- “Half the lanes means half the capacity.” Left-turn weaving already reduces how much traffic a four-lane undivided road can move. Stone Way carried the same peak-hour volume after its conversion.
- “Traffic will flood side streets.” On Stone Way, traffic on parallel streets fell 12 to 34 percent. San Jose shows that some streets can see increases, which is a reason to monitor, not proof that road diets fail.
- “Ambulances will get stuck.” In Cedar Rapids, response times showed no meaningful change, and the center turn lane gives emergency vehicles a clear path. Very congested corridors are the exception to watch for.
- “It hurts local business.” Charlotte’s East Boulevard gained $43 million in non-residential tax value, and the Indianapolis Cultural Trail drew more than $300 million in new development.
- “Road diets only work on quiet streets.” Los Angeles corridors carrying up to 28,000 vehicles a day saw substantially fewer collisions.
Frequently Asked Questions
What is a road diet?
A road diet removes travel lanes from a roadway and gives the space to other uses. The classic version turns a four-lane undivided road into two through lanes plus a center two-way left-turn lane. The leftover width often becomes bike lanes, refuge islands or parking.
Do road diets work?
For safety, yes. On former four-lane undivided roads, studies report 19 to 47 percent fewer crashes, and a combined analysis of 45 sites found a 29 percent drop. FHWA lists road diets as a proven safety countermeasure.
How does a road diet affect traffic flow and congestion?
On roads under about 20,000 vehicles per day, travel times often stay the same, because turning cars no longer block a through lane. Seattle’s Stone Way kept its peak-hour volume. Speeds drop modestly, by about 2 mph in Minnesota studies.
What are the benefits and trade-offs of a road diet?
Benefits include fewer crashes, slower and more uniform speeds, shorter pedestrian crossings and space for bike lanes, often at low cost when paired with resurfacing. Trade-offs include possible diversion onto some side streets, slower emergency vehicles on highly congested corridors, and traffic backing up behind stopped buses where there are no pull-outs.
How can a road diet’s success be measured?
Compare at least three years of crash data before and after, ideally with empirical Bayes methods. Also track speeds, delay, queuing, traffic diversion, transit operations and economic indicators such as property values.